Spectrum
The Spectrum view displays data related to the FFT in a graphical representation. At the machine level, all the FFTs of all the devices attached to the machine are available, while at the device level, only the FFTs of the selected device can be seen.
The Spectrum view contains the following sections:
Asset tree
FFTs List
Spectrum

User interaction
Video Example
Selecting FFTs
Clicking the items in FFTs list will select the spectra to be displayed in the graphs for acceleration and velocity. Clicking the checkbox next to Device will select or deselect all available FFTs, the date can be sorted descending or ascending, and clicking the trash icon will delete the selected FFTs.
Please note that deleting an FFT is irreversible.
Activation & Deactivation
A legend with the selected FFTs is available on top of the graph for the acceleration, velocity and envelope spectrum. Clicking on any of the items will toggle the activation in the graph.
Focus
Hovering on an item in the graph's legend will make the graph focus on the hovered measurement. Additionally, the FFTs list will also focus on the respective item in the table, providing clear insight into which FFT corresponds to which FFT in the list.
Data Points
The specific value of a point in the graph can be seen by hovering over the graph. By doing so, the frequency and magnitude of that point in the graph will be displayed.

Graph Functions
The graph functions are options available in the top right corner of the acceleration and velocity spectrum graph. These options allow the user to change what is displayed on the screen to assist in data analysis. The options available are as follows:

Spectrum selection: select the type of spectrum to visualize (acceleration, velocity, or envelope)
Units selection: change the units used in the graph among the available options. For acceleration and evelope: G, m/s², ft/s²; and for velocity: mm/s and inch/s.
Hz/CPM Toggle: Rescale the horizontal axis to CPM or back to Hz.
Toggle thresholds: show or hide the threshold guide lines.
Toggle bearing faults: if bearing faults are defined, clicking this icon will toggle the bearing fault guides.
Toggle RPM: activate or deactivate the RPM indicator.
Harmonic cursors: display or not the harmonic cursors in the graph.
Sideband cursors: show or hide sideband cursors if added to the FFT.
Export: download the graph's data in CSV format.
Fullscreen: expands the graph view to fullscreen.
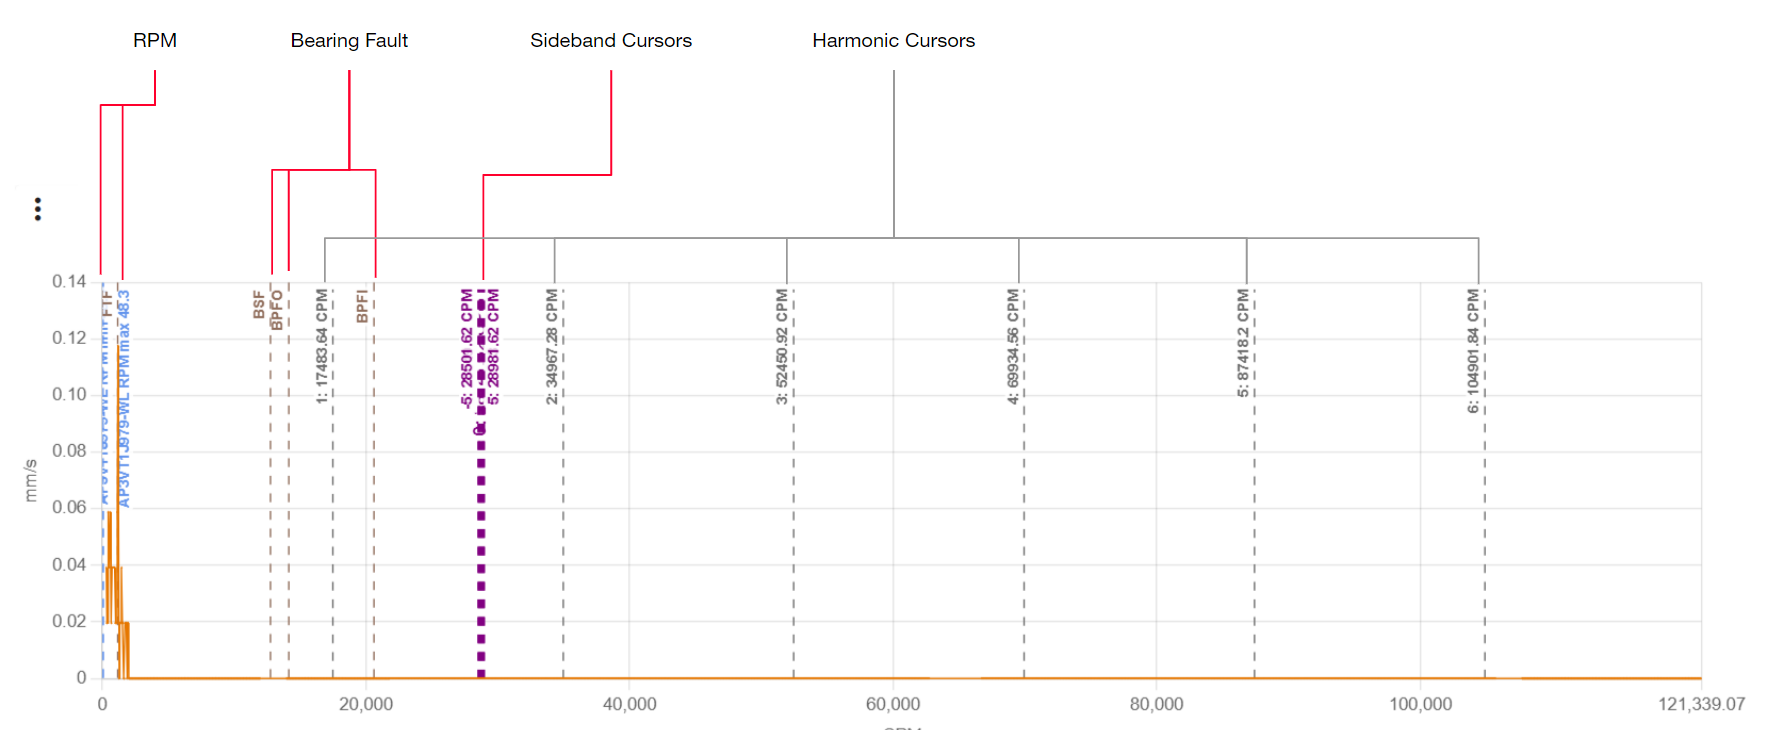
An example of some of the available options previously mentioned turned on is presented next,

Cursors
Cursors can be added to a spectrum graph in two ways. The first option is to hover a point in the graph and click the desired starting point.

After that, the user can select to set harmonic or sideband cursors. An example of both cursors set with this method is shown below.

With the cursors on the user can click on them to remove them or drag them to a different position.
Annotations
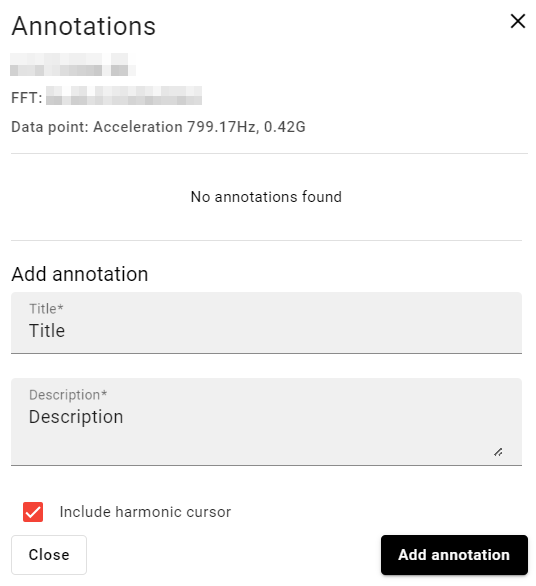
Point annotations can be accessed and added by clicking on a point in the graph. This will make a pop-up window appear where the user can read previous annotations or add a new one.
The user must add a title and description. Additionally, the user can include the harmonic cursors if these are on the graph by marking the checkbox at the bottom of the pop-up window.

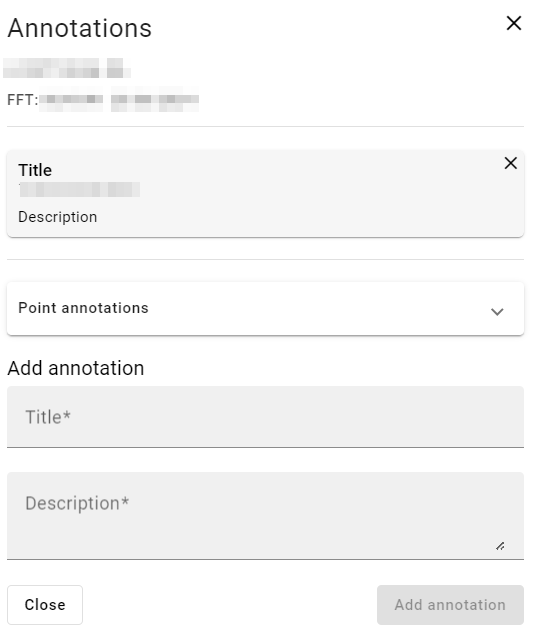
Point annotations will show at the point of the graph where they were saved. General annotations can be accessed using the vertical ellipsis on the FFTs list. Clicking on it will make a drop-down menu appear with the option Annotations. Clicking on it will display a pop-up window where the user can read and manage annotations.

Last updated