# Device health
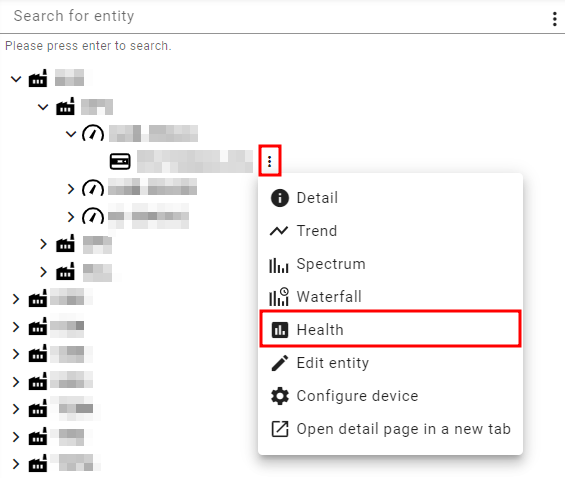
To access the device health dashboard, first click on the vertical ellipsis that appears when hovering over the device in the asset tree. In the displaying sub-menu, select the **Health** option.
Example to access the device health dashaboard from the asset tree
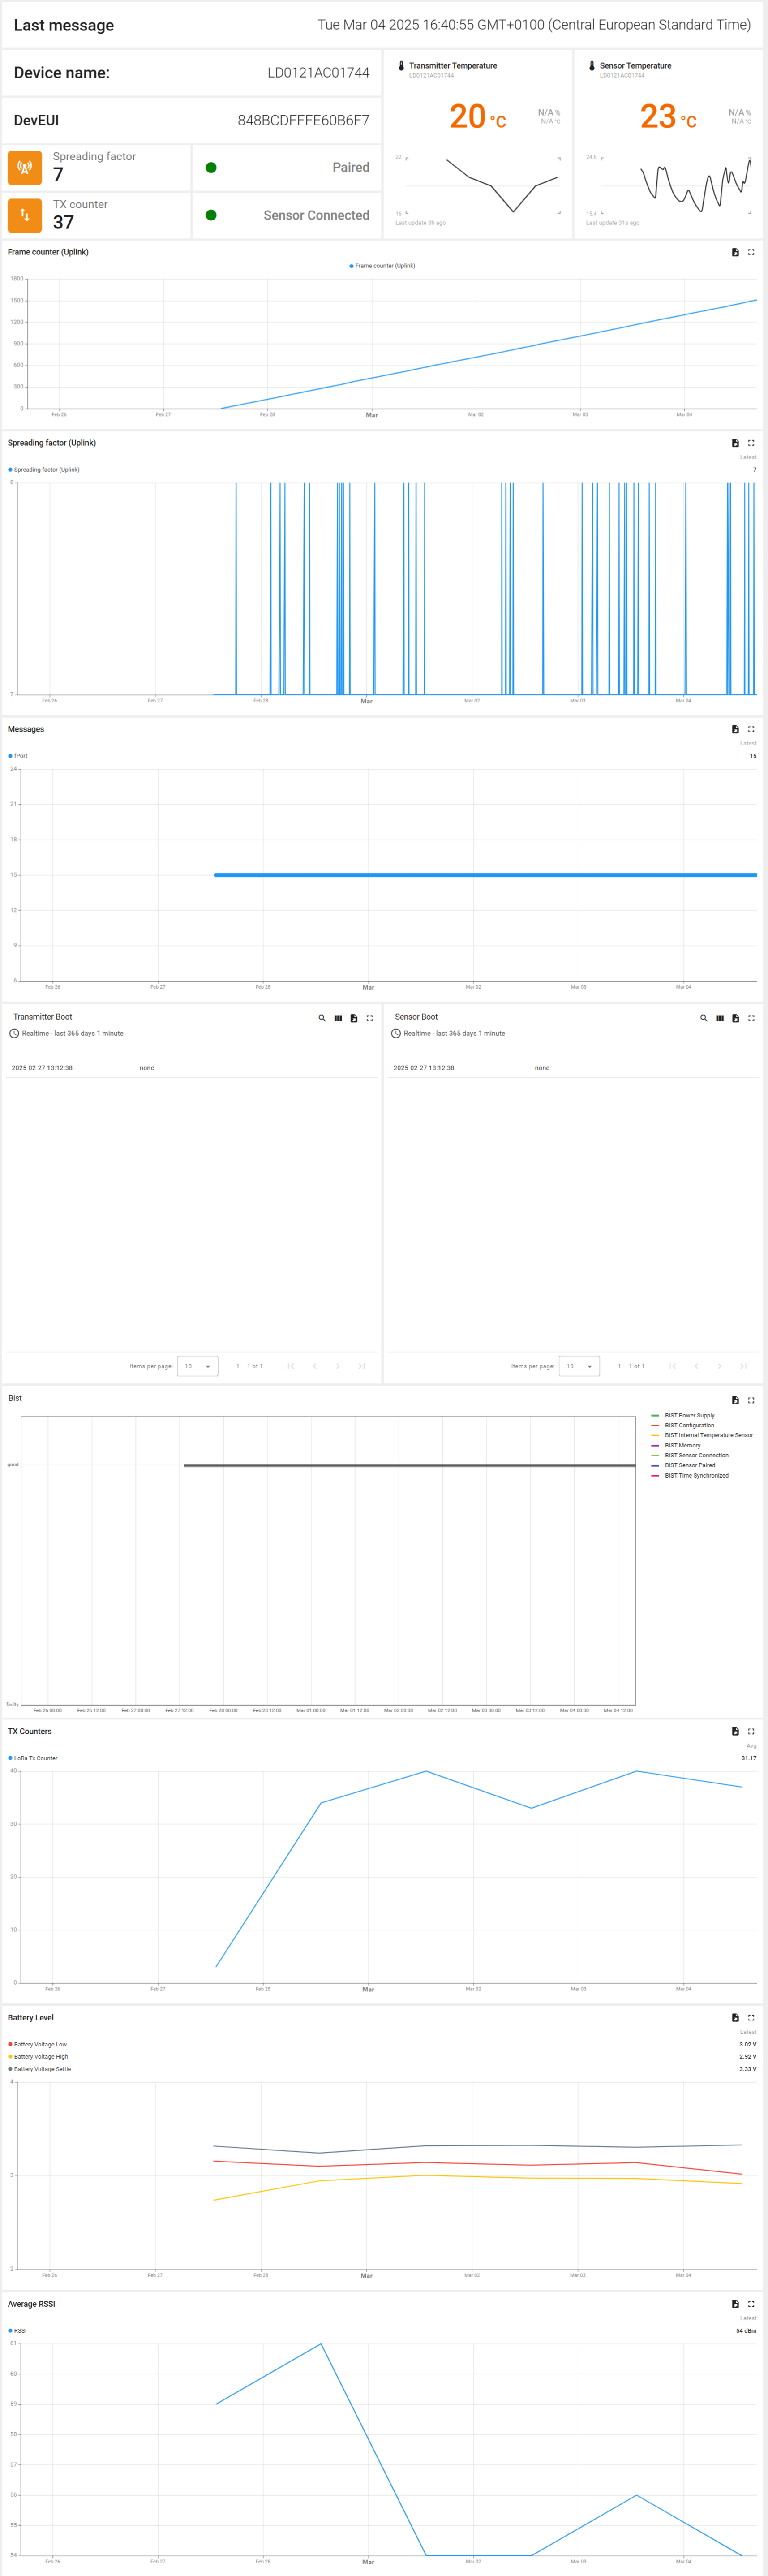
The device health dashboard comprises the following sections:
* **Metadata**: where the device's name, devEUI, and the date of the last message.
* **Communication status**: indication of the device's current spreading factor and TX counter.
* **Sensor status**: indication of the sensor's pairing and connection.
* **Transmitter temperature**: temperature reported in the device's health messages.
* **Sensor Temperature**: temperature of the probe.
* **Frame counter graph**: indication of the transmitted frames.
* **Spreading factor graph**: a visual representation of the spreading factor over time.
* **Messages fPort**: graph with a representation of the message's fPort over time.
* **Transmitter and Sensor Boot tables**: table with timestamp and reason for booting of the sensor and the transmitter.
* **Bist graph**: self-test Bist result over time.
* **TX counter graph**: TX counter over time.
* **Battery level graph**: battery level over time.
* **Average RRSSI graph**: average RRSSI over time.
An example of the dashboard is presented in the following figure.
Example of the device health dashboard
### User interaction
The user can interact with the graphs and tables in the device health overview as follows:
* In a graph, hovering over a point will display the value and timestamp where the mouse is pointing.
* In a table or graph, the user can expand to fullscreen or export the data with the icons at the top right corner of the widget.
* In a table, search functions and column display options are available in the icons in the top right corner.