
Spectrum view sections
Spectrum view sections

Data point example

Graph functions example

Dropdown after clicking a point in a spectrum graph

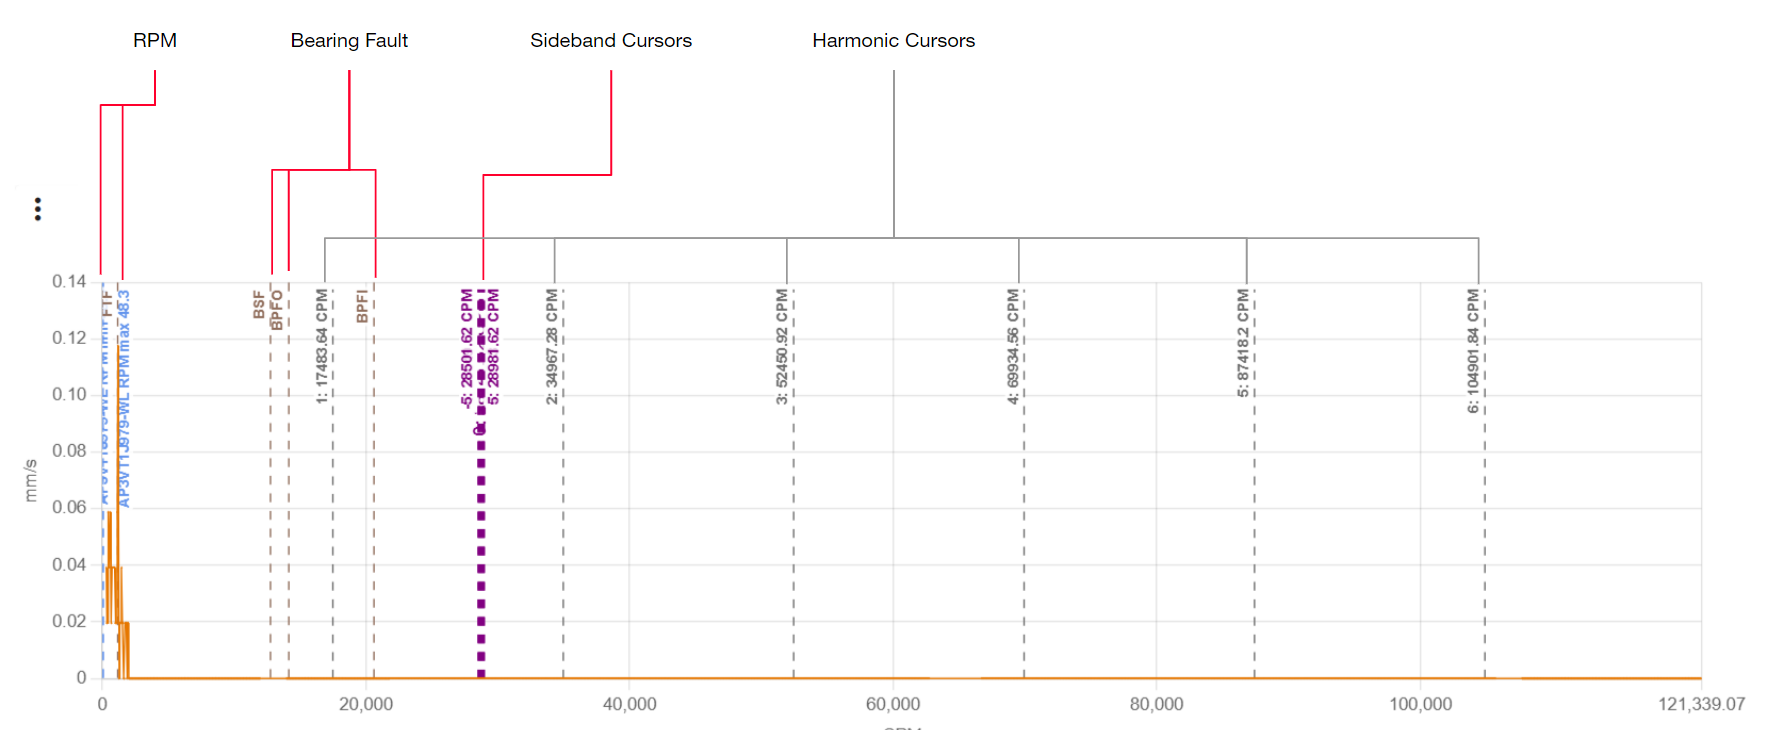
Harmonic and sideband cursos set in a graph
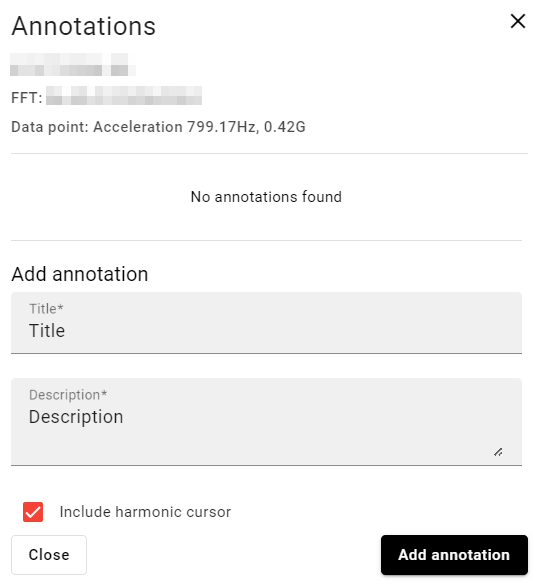
Example of the Annotations pop-up window
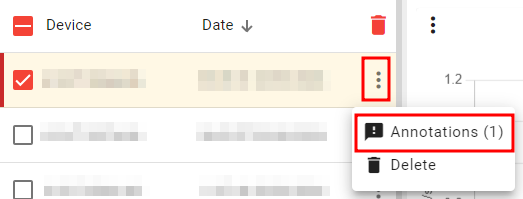
General annotations access
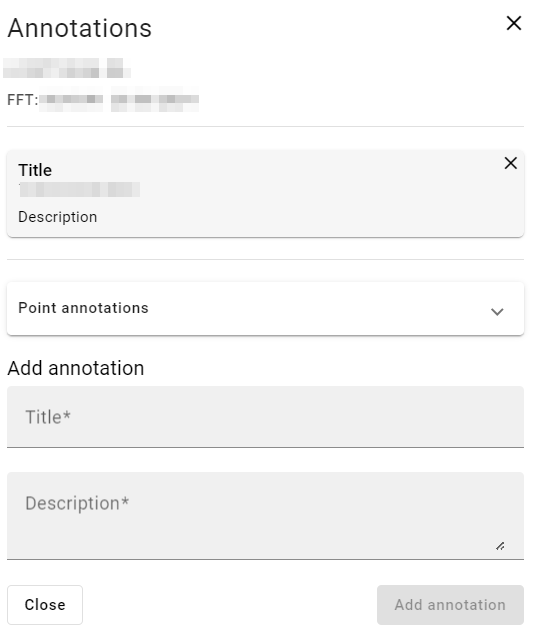
General Annotations pop-up window example