# Trend
The **Trend** view displays the time-domain data in a graphical representation. At the machine level, the trend view shows the data of all the devices in the machine, whereas at the device level, the data displayed is related only to that specific device.
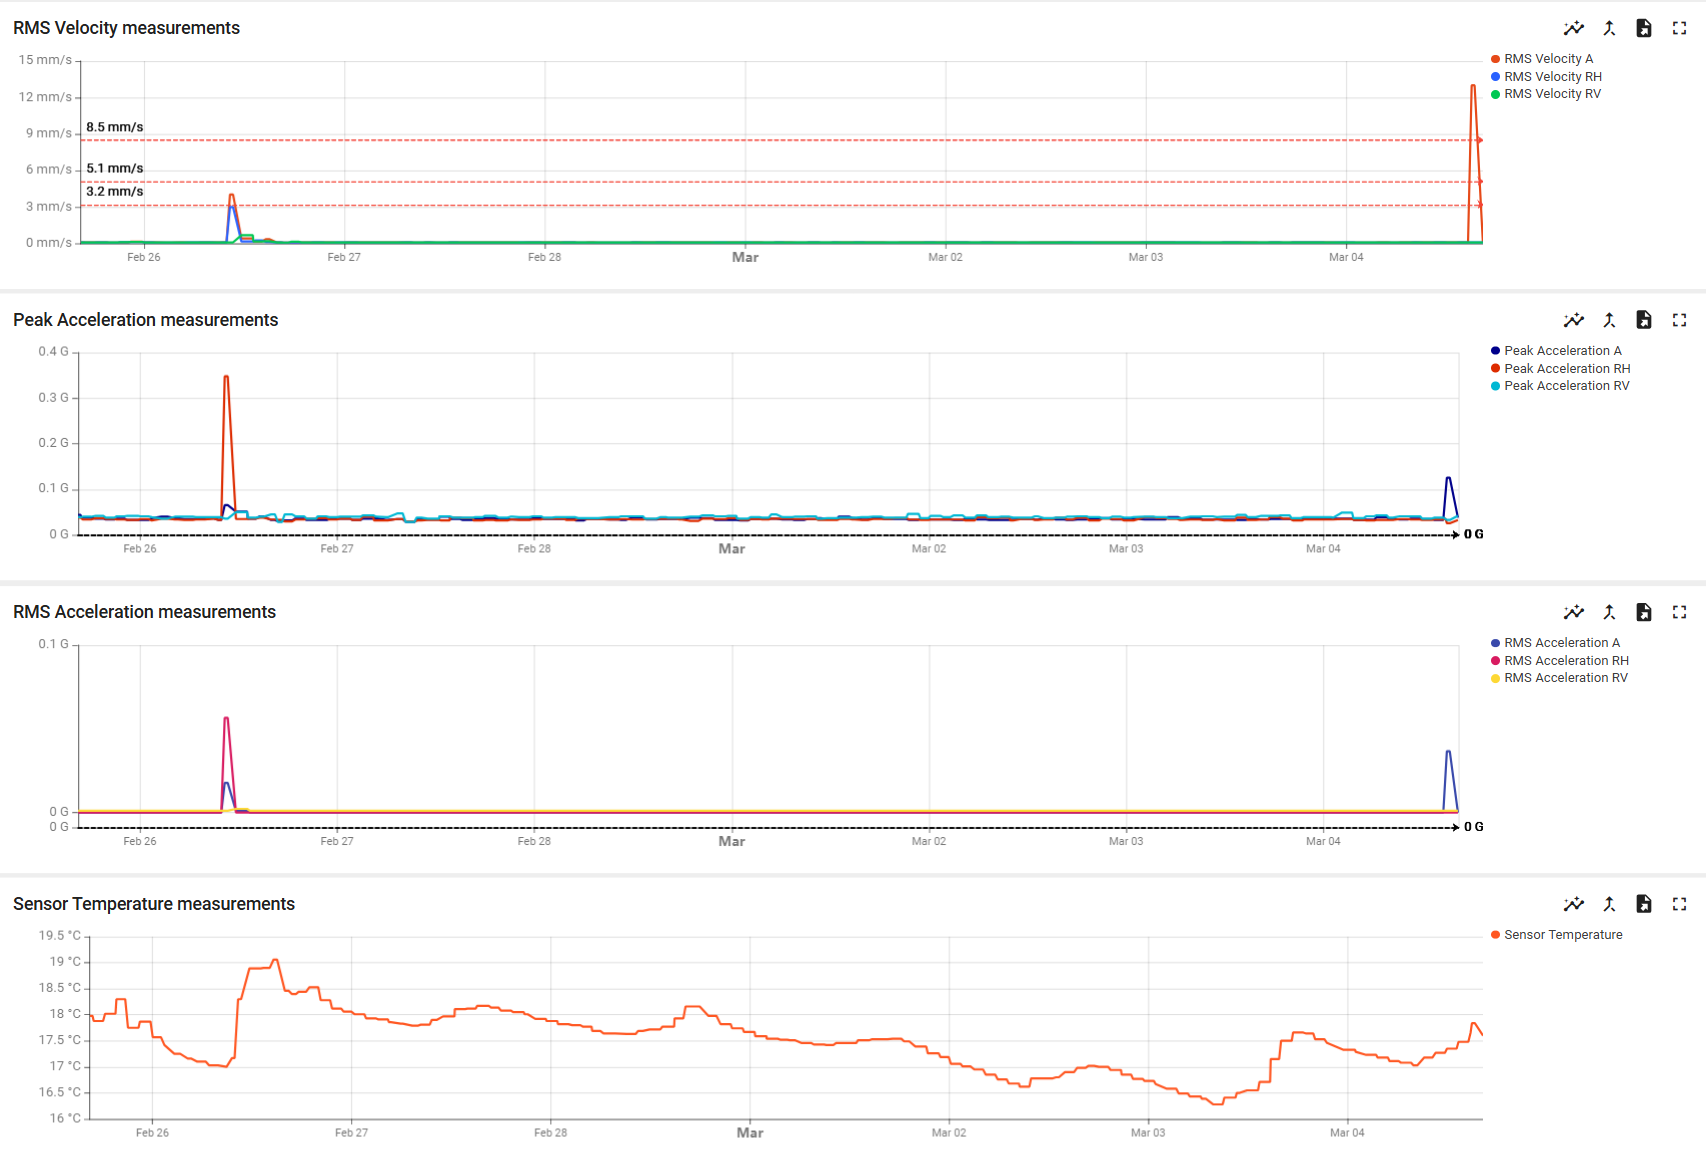
In the case of the NEON Vibration Sensor, the trend view displays 3 graphs: RMS velocity on the 3 axes, peak acceleration on the 3 axes, and the sensor's temperature. The image below shows an example of the trend view of a device.
Trend view example
## User Interaction
The user can interact with the graphs available in the trend view. The following sections provide details on how to use the features available in SolidRed's trend view.
### Activation & Deactivation
The legend on the far right of the graph allows the user to choose which measurements to display in the graph. A deactivated measurement is grayed out, while an activated one has a defined color. Clicking on the measurement will toggle its activation.
### Focus
Hovering on a measurement in the graph's legend will make the graph focus on the hovered measurement.
### Data Points
The specific value of a point in the graph can be seen by hovering on the graph. By doing so the value and the timestamp of the activated measurements of the graph will display.
### Alerts
Alerts defined in the device overview will show up in the related trend graph as a threshold dotted line.
### Statistics
Clicking on the statistics icon will display a dashboard with statistical measurements like maximum and averages.
Example on where to locate the statistics icon
Statistics dashboard
### Combine and Split
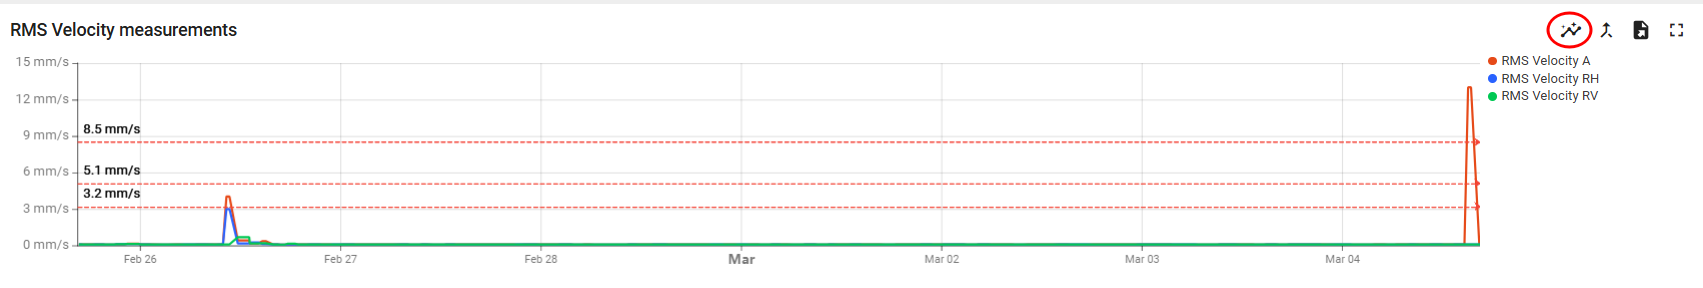
Clicking on the combine/split icon on the top right of a graph will change the trend view from separated dashboards containing measurements per category to a single graphical view of the overall data.
Example on where to locate the combine/split icon
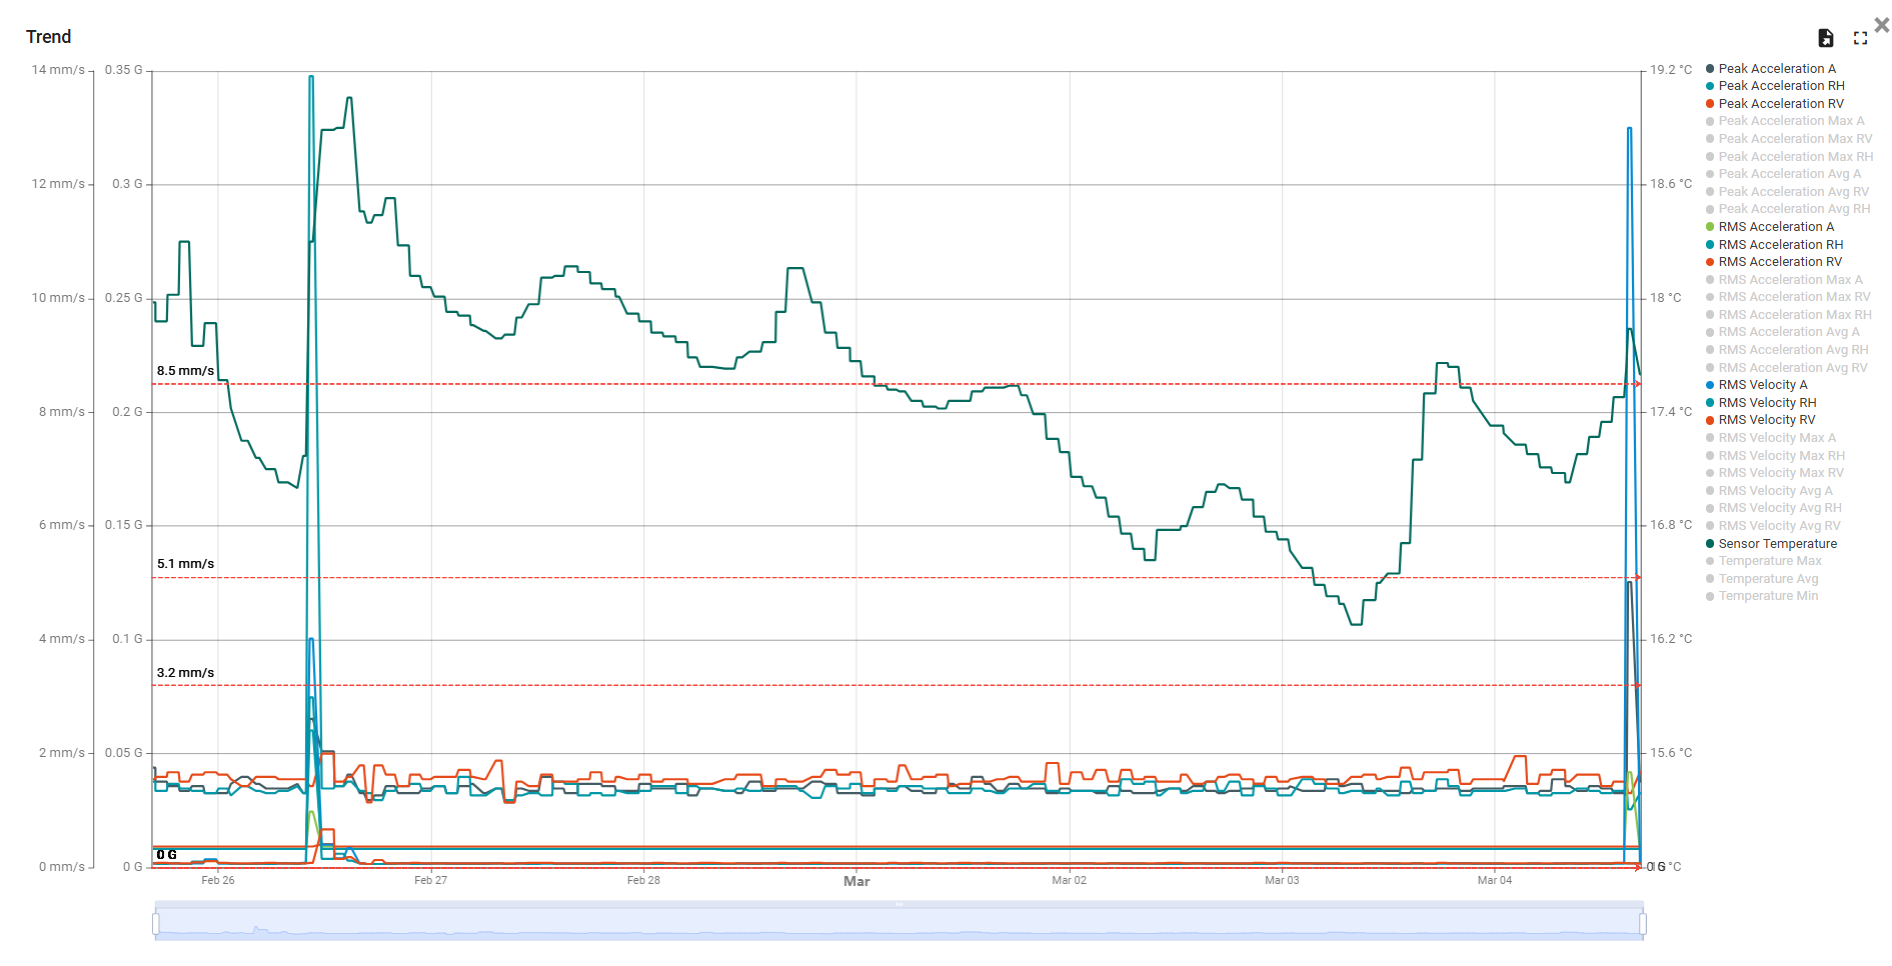
An example of such a view is displayed next.
xample of a combined trend view
Clicking again on the same icon will split the trend view into separate graphs per category as before. Additionally, the user can drag the bottom cursor to navigate to a specific part of the graph to focus on a section or add more detail.
### Export
Clicking on the export icon on the top right corner of a graph will allow the user to download the data in CSV, XLS, or XLSX format.
### Fullscreen
Click on the fullscreen icon to expand the graph's view to fullscreen.