> For the complete documentation index, see [llms.txt](https://docs.twtg.io/docs/llms.txt). Markdown versions of documentation pages are available by appending `.md` to page URLs; this page is available as [Markdown](https://docs.twtg.io/docs/solidred-documentation/solidred-3.3/data-analytics-features/device-health.md).
# Device health
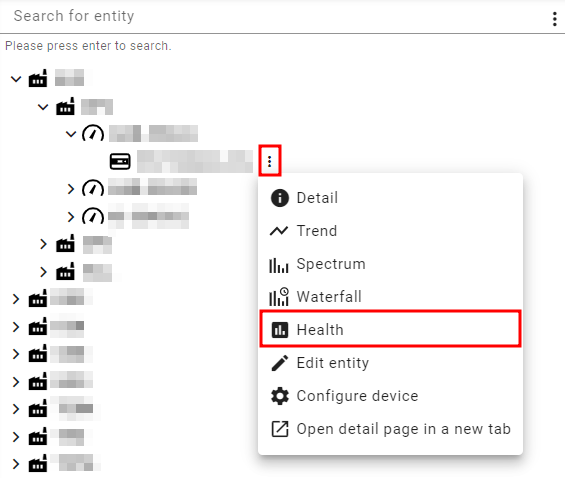
To access the device health dashboard, select the desired device and click on the device health icon on the top of the detail tab. Alternatively, click on the vertical ellipsis that appears when hovering over the device in the asset tree. In the displaying sub-menu, select the **Health** option.
Example to access the device health dashaboard from the asset tree
Example to access the device health dashboard from the detail tab
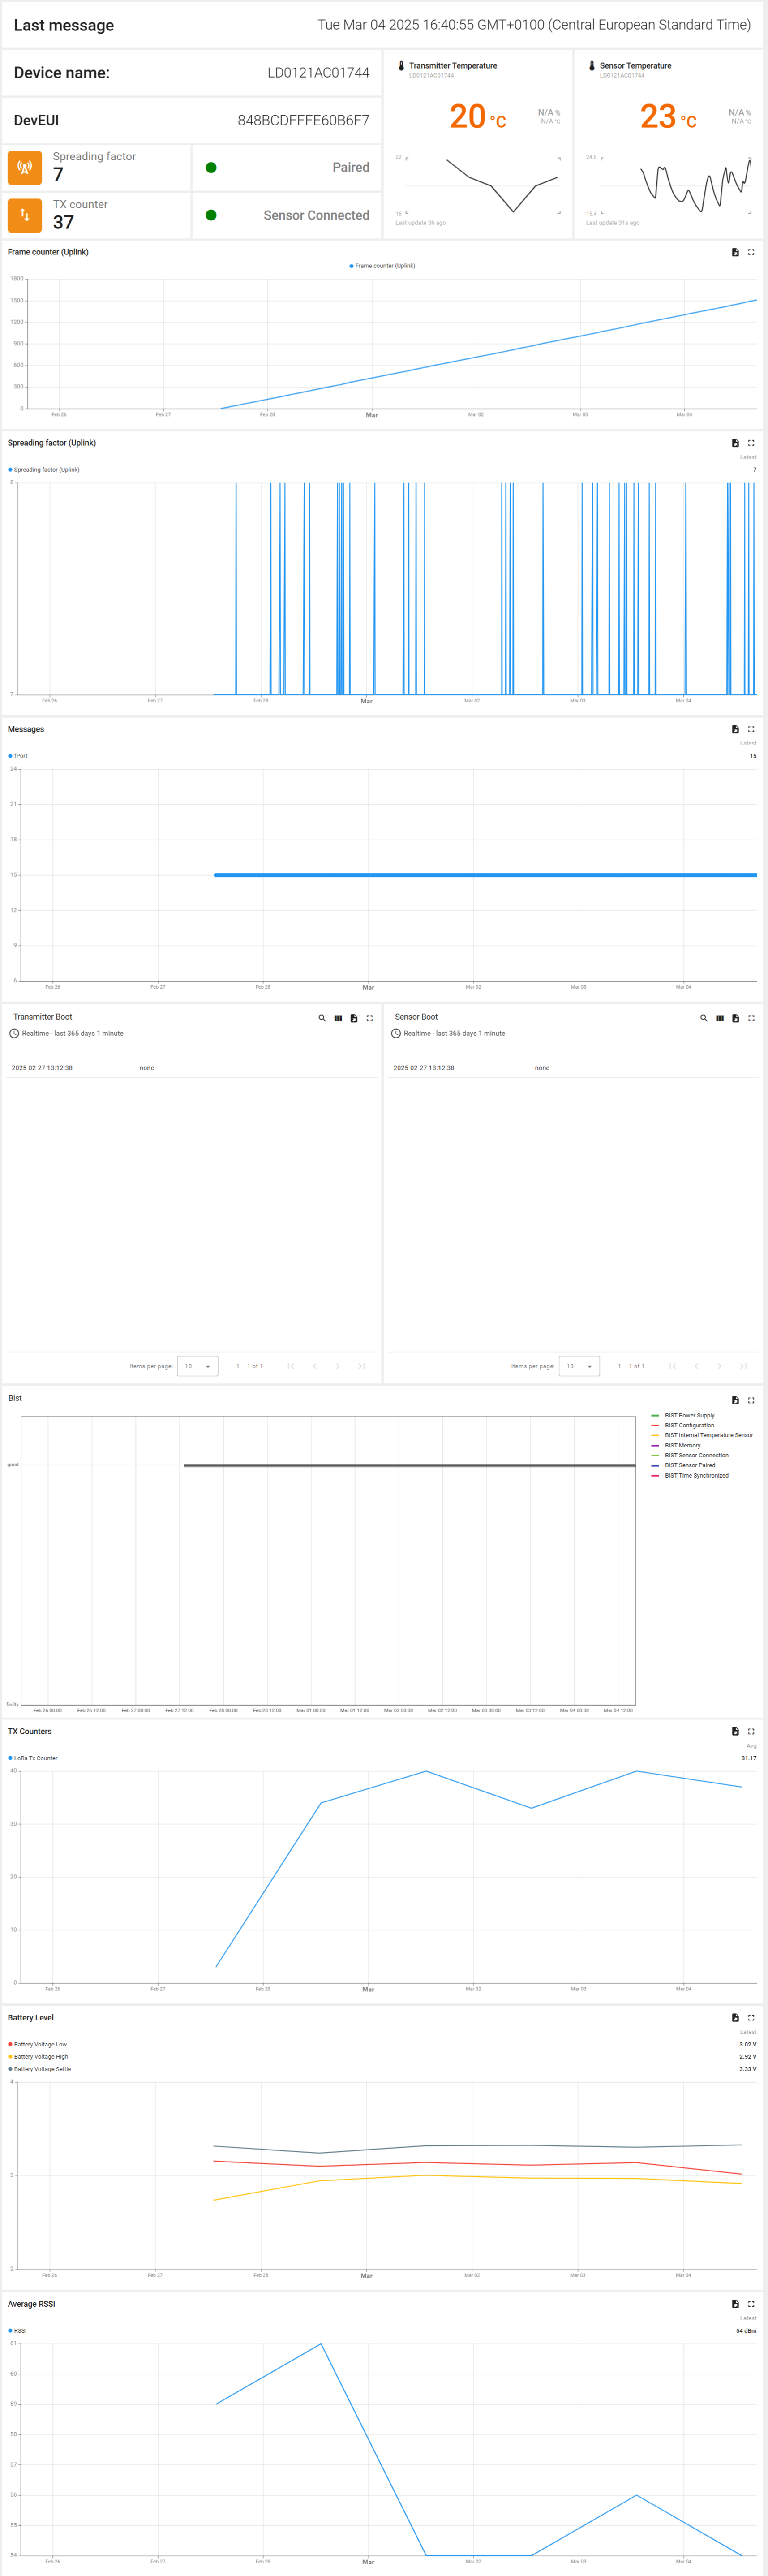
The device health dashboard comprises the following sections:
* **Metadata**: where the device's name, devEUI, and the date of the l
* ast message.
* **Communication status**: indication of the device's current spreading factor and TX counter.
* **Sensor status**: indication of the sensor's pairing and connection.
* **Transmitter temperature**: temperature reported in the device's health messages.
* **Sensor Temperature**: temperature of the probe.
* **Frame counter graph**: indication of the transmitted frames.
* **Spreading factor graph**: a visual representation of the spreading factor over time.
* **Messages fPort**: graph with a representation of the message's fPort over time.
* **Transmitter and Sensor Boot tables**: table with timestamp and reason for booting of the sensor and the transmitter.
* **Bist graph**: self-test Bist result over time.
* **TX counter graph**: TX counter over time.
* **Battery level graph**: battery level over time.
* **Average RRSSI graph**: average RRSSI over time.
An example of the dashboard is presented in the following figure.
Example of the device health dashboard
{% hint style="info" %}
### Additional information might be available based on the use case and the device type.
{% endhint %}
### User interaction
The user can interact with the graphs and tables in the device health overview as follows:
* In a graph, hovering over a point will display the value and timestamp where the mouse is pointing.
* In a table or graph, the user can expand to full screen or export the data with the icons at the top right corner of the widget.
* In a table, search functions and column display options are available in the icons in the top right corner.
---
# Agent Instructions
This documentation is published with GitBook. GitBook is the documentation platform designed so that both humans and AI agents can read, navigate, and reason over technical content effectively. Learn more at gitbook.com.
## Querying This Documentation
If you need additional information that is not directly available in this page, you can query the documentation dynamically by asking a question.
Perform an HTTP GET request on the current page URL with the `ask` query parameter, and the optional `goal` query parameter:
```
GET https://docs.twtg.io/docs/solidred-documentation/solidred-3.3/data-analytics-features/device-health.md?ask=&goal=
```
`ask` is the immediate question: it should be specific, self-contained, and written in natural language.
`goal` is optional and describes the broader end goal you are ultimately trying to accomplish on behalf of the user. GitBook uses it to tailor the answer towards what is most useful for that goal.
The response will contain a direct answer to the question and relevant excerpts and sources from the documentation.
Use this mechanism when the answer is not explicitly present in the current page, you need clarification or additional context, or you want to retrieve related documentation sections.