Device overview
The device overview detail page provides insights into the device's general status and readings. An example of the view is presented in the following image.

1. Device information
In the device information section, the user can:
Manage the device's image. Hovering the image will make the available options visible.
Set the machine alerts and RPM. More information is available in this section.
Click on the battery icon to check the device's battery level.
Click on the signal icon to check the device's signal strength.
Click on the health icon to look at the device health information.
Click on the gear icon to configure the device.
Click on the pencil icon to edit the device.
Add or edit a description. Hovering in the section will make the icon to interact with the section visible.
Add or edit annotations. Hovering in the section will make the icon to interact with the section visible.
2. Health indicators
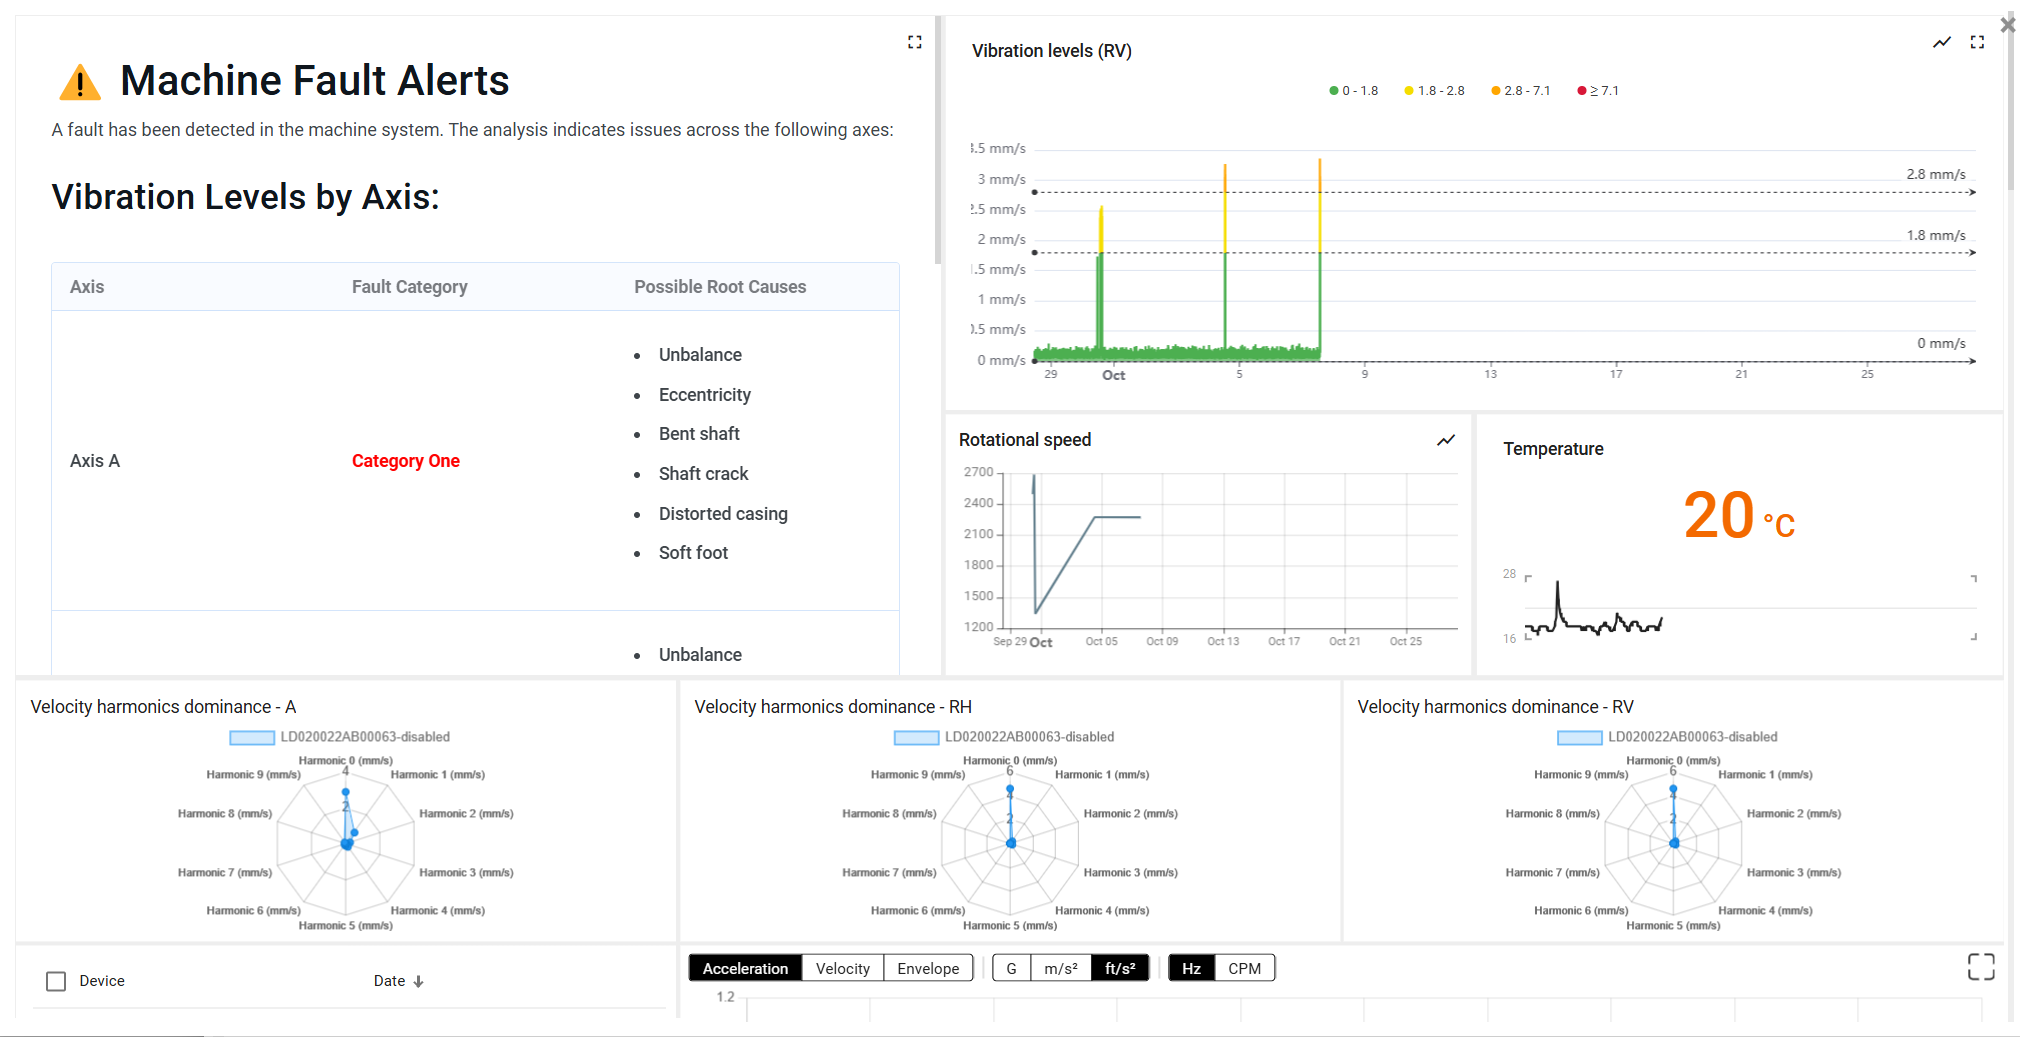
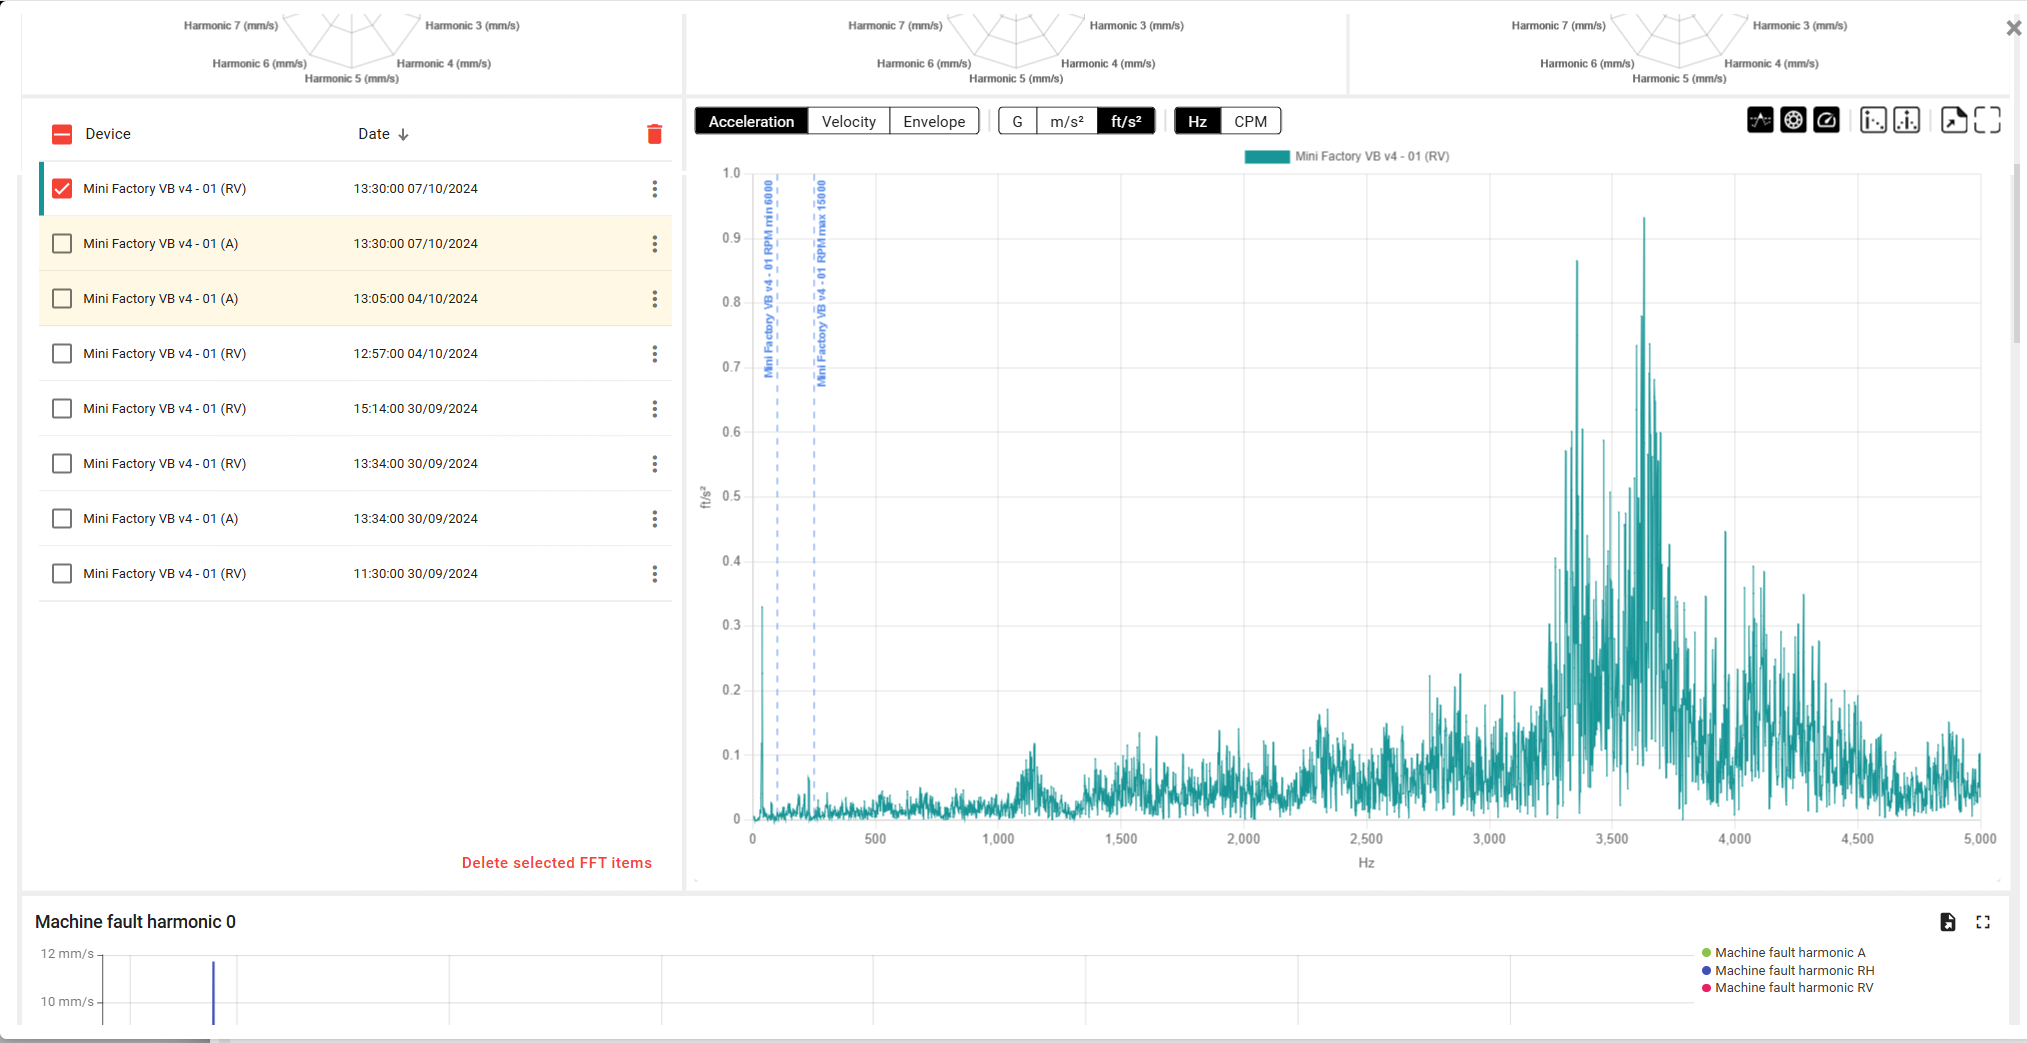
Health indicators are shown based on the device configuration. Clicking on the eye icon that appears when hovering over the status will open a dashboard with insights on the status of the devices and asset status. These indicators are particularly useful to check the health of the monitored assets. For example, the machine fault displays the following information.


3. Sensor data
A part of the sensor data collected by the devices is displayed in this section. In the case of the NEON Vibration Sensor, the vibration levels are displayed.
Last updated